Business Analytics / 2025 · 2 min read
Bank Jatim Performance Dashboard
An interactive Power BI dashboard mapping IT performance indicators to the IT Balanced Scorecard framework.
- Role
- Business intelligence analyst
- Outcome
- IT-BSC
- Status
- Completed / 2025
- Stack
- Power BI · IT-BSC Framework · KPI Mapping · Data Storytelling · Performance Visualization
Context
IT performance is easier to evaluate when strategy, KPIs, and dashboard design are connected clearly. This project used the IT Balanced Scorecard framework as the structure for performance visualization.
Problem
The dashboard needed to translate performance signals into a view that supported interpretation, not just display charts.
My Role
I worked on KPI mapping, dashboard structure, visual hierarchy, and data storytelling.
Evidence
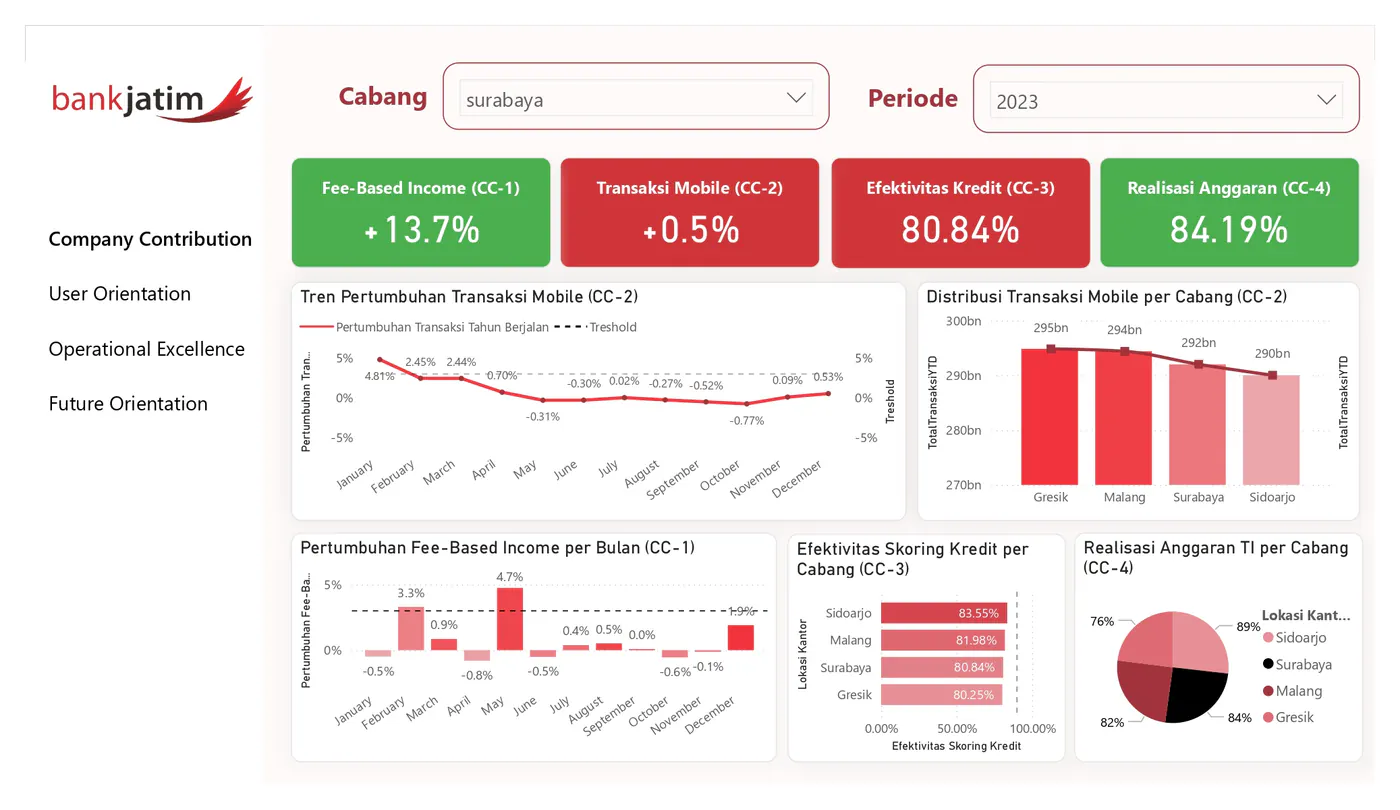
Dashboard evidence: IT-BSC company contribution view with KPI cards, trend charts, branch comparison, and budget realization visuals.
Approach
- Mapped IT performance indicators to the IT-BSC framework.
- Structured dashboard views around measurable KPIs.
- Designed visuals for scanability and business alignment.
- Framed the dashboard as a decision-support artifact.
Key Decisions
The dashboard used framework-based grouping so users could understand how metrics relate to IT strategy and performance dimensions.
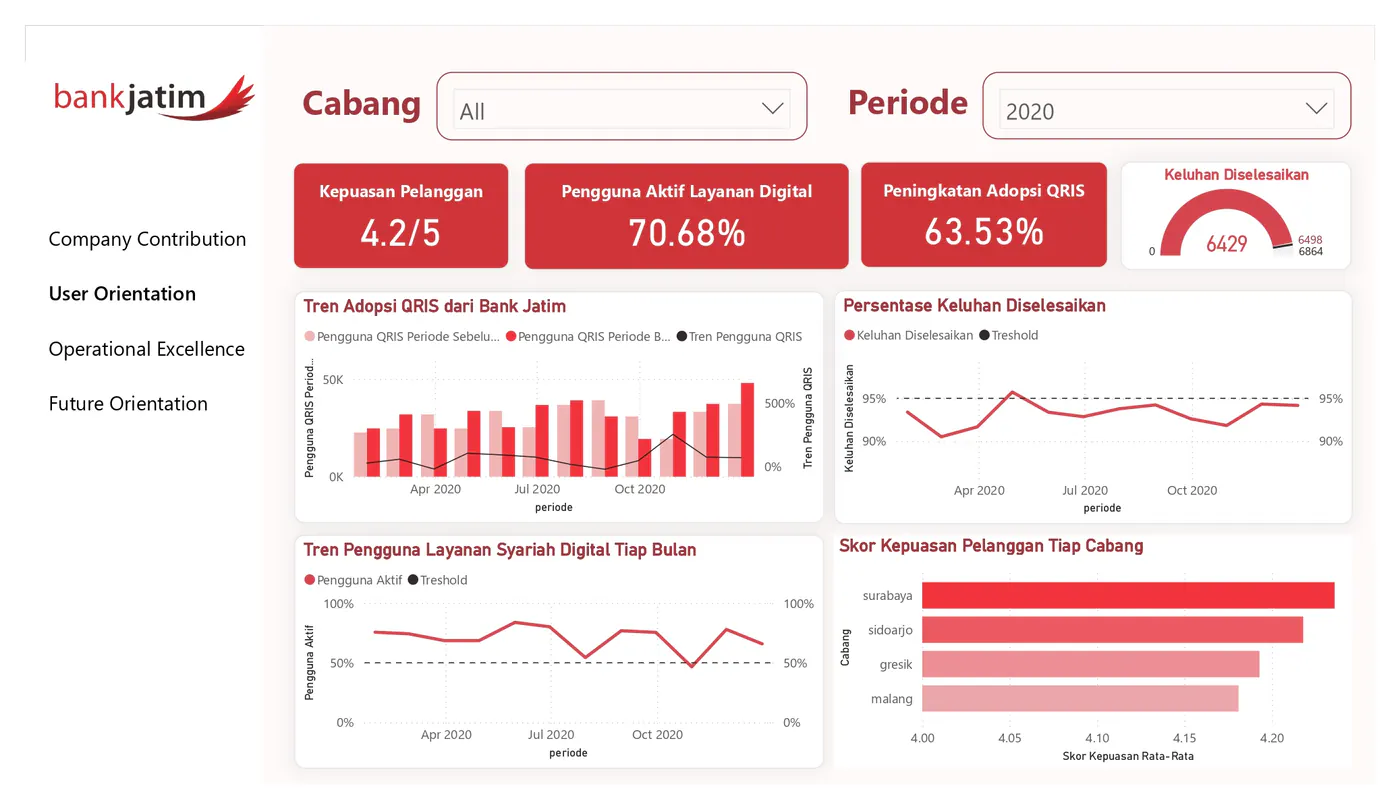
User orientation perspective with metric cards and supporting charts.
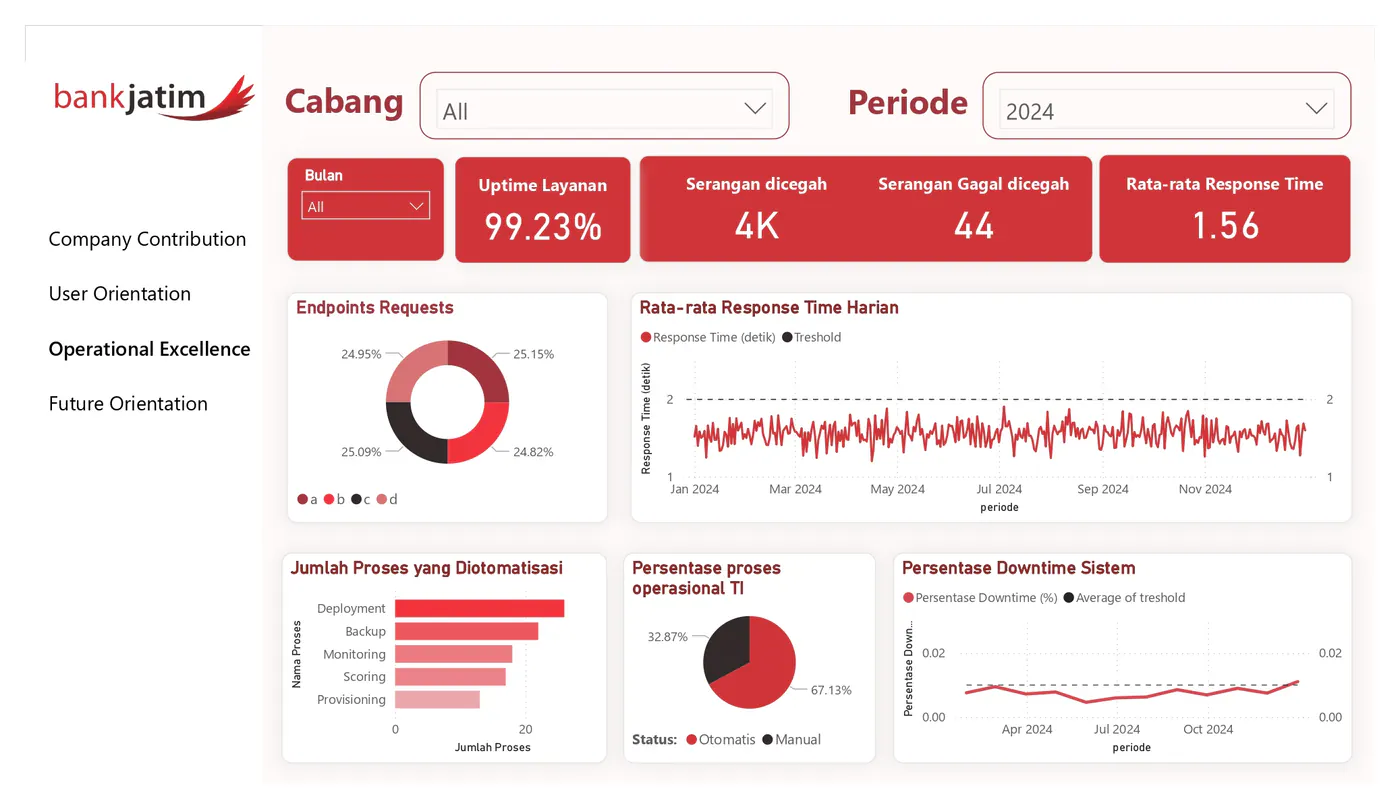
Operational excellence perspective for scanning performance by branch and KPI.
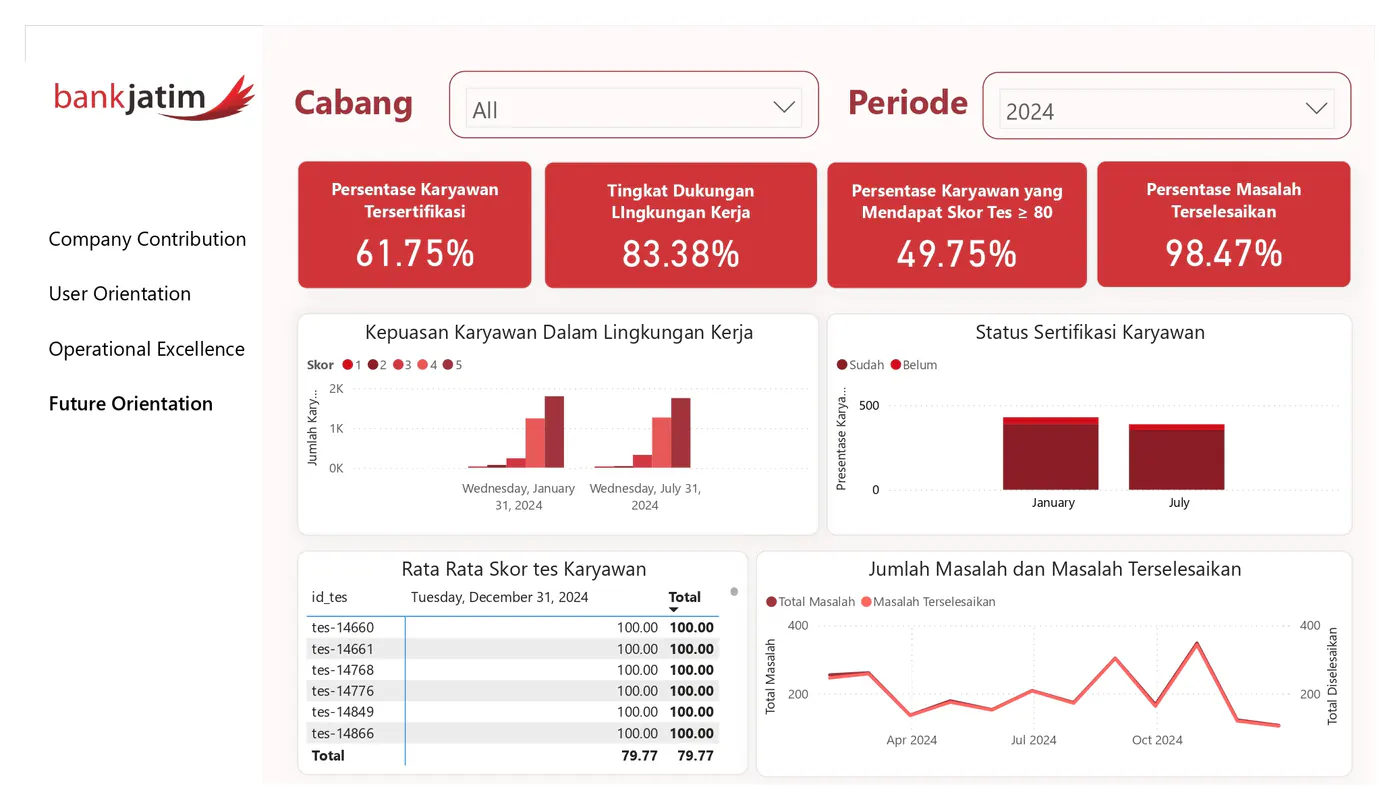
Future orientation perspective with a consistent dashboard grammar.
Result
The project produced an interactive Power BI dashboard that connected IT strategy with measurable KPIs.
The PDF evidence is available as a static portfolio artifact: Dashboard Bank Jatim Pusat PDF.
What I’d Improve
I would add clearer before-and-after KPI context, document dashboard user roles, and include a short narrative for executive review.