LA Crime Type Prediction
A multi-class classification case study predicting Los Angeles crime codes from time, location, premise, status, and victim attributes.
Visual Exhibit
System Blueprint & Verification.
Algorithmic mechanism and measured empirical evidence from the shipped system.
SVM RBF baseline across 138 crime categories
Engineering Takeaways
Key Pillars & Findings.
976k raw crime records
Balanced 13,800-row modeling dataset
SVM, KNN, Naive Bayes, Logistic Regression, Decision Tree, and BPNN comparison
Technical Specification & Methodology Notes Expand paper spec
Context
Crime data can reveal patterns across time, geography, premise, case status, and victim context. This academic project used cleaned Los Angeles crime records from 2020 to 2024 as a supervised multi-class classification problem.
Problem
The dataset was large, highly multi-class, and imbalanced. The challenge was not only to train a model, but to prepare categorical features, balance target classes, compare model behavior, and avoid overstating performance in a sensitive public-safety domain.
My Role
I worked on data preparation, model comparison, imbalance handling, and evaluation design.
Evidence
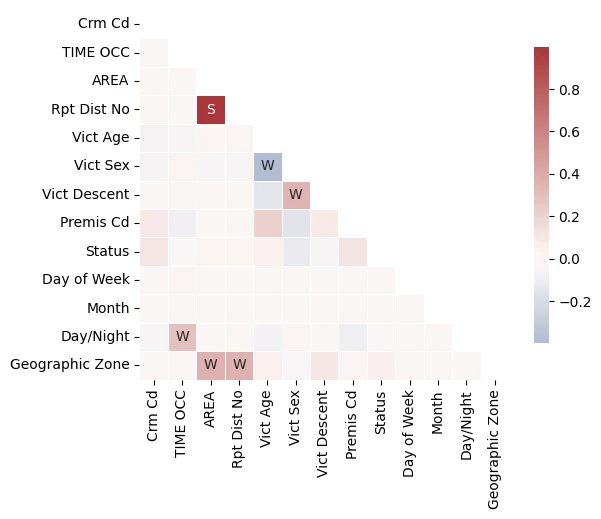
Notebook output: Spearman correlation across candidate features. The strong Reporting District ↔ Area pair drove the redundant-column removal in feature selection.
The dataset itself: 976k raw records from 2020-2024, reduced to 138 modeled classes after removing single-instance targets, then balanced to a 13,800-row modeling dataset (100 samples per class).
Approach
- Prepared features from time, area, reporting district, premise, case status, day of week, month, day/night category, geographic zone, and victim attributes.
- Removed redundant or unsafe modeling columns, then encoded categorical features for classical machine learning models.
- Removed single-instance target classes and balanced the dataset to 100 samples per modeled class.
- Compared KNN, Naive Bayes, Logistic Regression, SVM, Decision Tree, and BPNN.
- Evaluated results with Accuracy, macro Precision, macro Recall, macro F1, and macro AUC ROC.
Key Decisions
The project compared several model families instead of relying on a single high-level score. I treated SVM with RBF kernel as the strongest deployable baseline because it led accuracy and macro F1, while the BPNN result required audit despite a high AUC value.
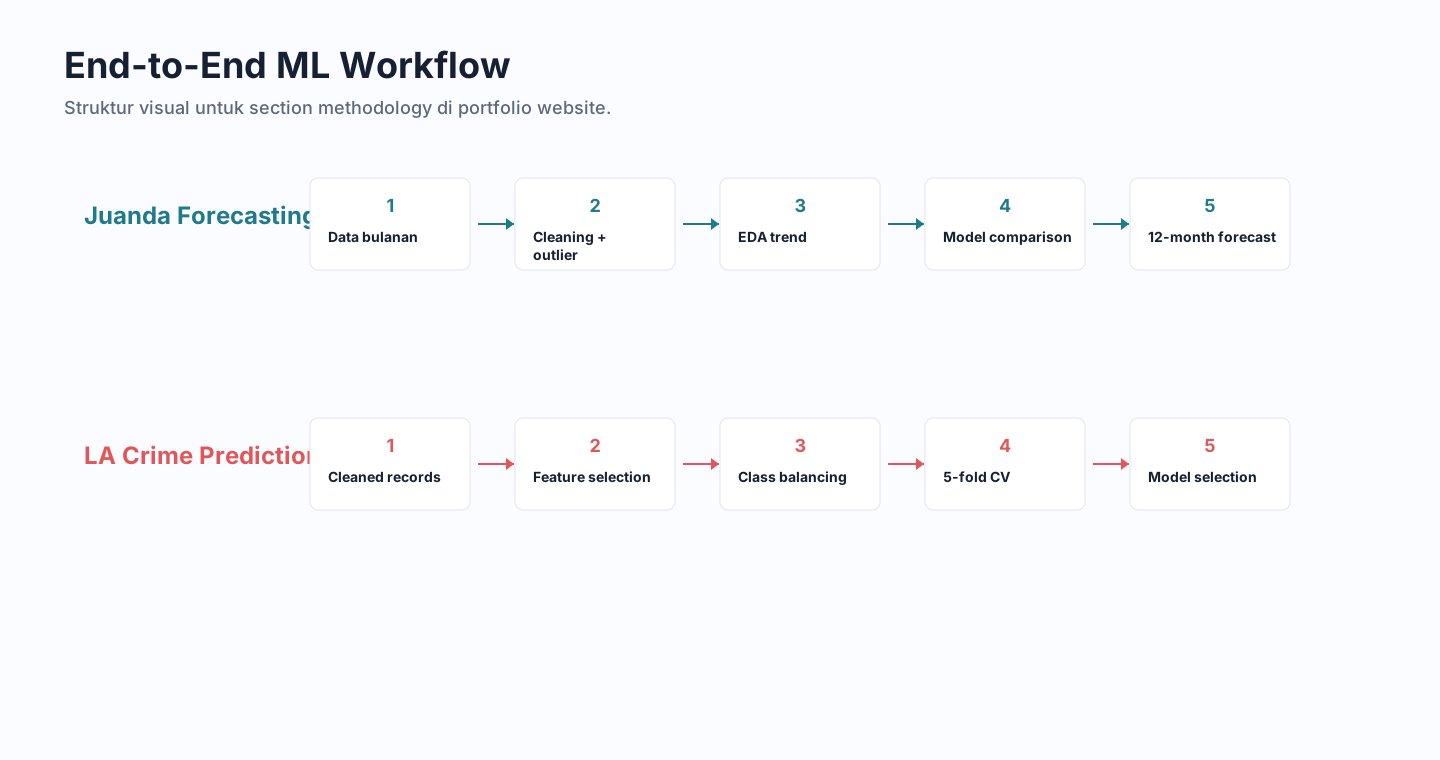
Workflow diagram (made for this write-up, not a tool export): data preparation, EDA, class balancing, model experimentation, evaluation, and selection.
Test-set results for the best configuration of each model family, as printed in the notebook:
| Model | Accuracy | Macro F1 | Macro AUC ROC |
|---|---|---|---|
| SVM (RBF, C = 10) | 0.321 | 0.303 | 0.658 |
| KNN (k = 3) | 0.279 | 0.252 | 0.637 |
| Logistic Regression | 0.104 | 0.069 | 0.549 |
| Naive Bayes | 0.078 | 0.048 | 0.536 |
| Decision Tree | 0.074 | 0.039 | 0.534 |
| BPNN | 0.000 | 0.000 | 0.793 |
The BPNN row is the audit flag mentioned above: a 0.793 AUC next to zero accuracy points to a label-mapping problem in the notebook’s output layer, not a usable model, so it was excluded from baseline selection rather than reported as a win.
Result
SVM with RBF kernel and C = 10 became the strongest deployable baseline in the notebook, with accuracy 0.321 and macro F1 0.303 on the test set. The score is intentionally presented with context because the target space contains 138 modeled classes.
What I’d Improve
I would audit the BPNN label mapping, add top-k accuracy, include confusion-matrix analysis for frequent crime classes, test boosting models such as XGBoost or LightGBM, and add feature importance or SHAP-style interpretability.
Responsible Use Note
This project should be read as an academic modeling exercise, not as an automated decision-making system for policing or legal action. Crime datasets can reflect reporting bias, location bias, and complex social context that model scores alone cannot resolve.