Predictive Modeling / 2025 · 2 min read
Juanda Airport Visitor Forecasting
A time-series forecasting case study predicting monthly Juanda Airport visitor demand from 2014 to 2023 data.

- Role
- Data science practitioner
- Outcome
- R2 0.869
- Status
- Completed / 2025
- Stack
- Python · Pandas · NumPy · Scikit-learn · Random Forest
Context
Airport visitor demand changes across time because of seasonality, travel patterns, and external operational factors. This academic forecasting case study used monthly Juanda Airport visitor data from 2014-2023 to compare baseline, ensemble, and hybrid deep learning approaches.
Problem
The core problem was to forecast future visitor counts from historical time-series data while keeping the comparison understandable and measurable. The data also contained a sharp mobility drop during the pandemic period, so preprocessing and model comparison mattered as much as the final score.
My Role
I handled data preparation, descriptive analysis, outlier handling, normalization, model setup, baseline comparison, and forecasting evaluation.
Evidence
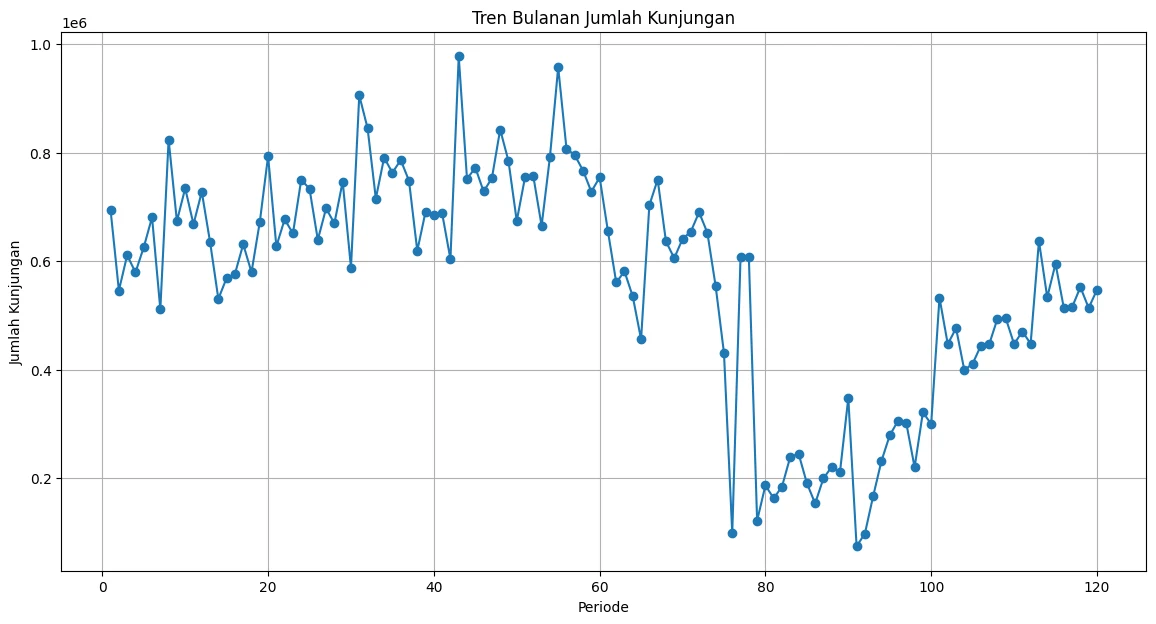
Notebook output: the 120 monthly observations, including the sharp pandemic drop in 2020 and the partial recovery afterwards.
Approach
- Cleaned the monthly visitor dataset and checked missing values, duplicates, and descriptive statistics.
- Handled low outliers using a quantile-based rule, then normalized values with Min-Max Scaling.
- Compared Linear Regression, Random Forest Regressor, and CNN-LSTM across multiple train-test split scenarios.
- Evaluated model performance using R2, MAE, MSE, and MAPE.
- Selected the strongest notebook result based on both explanatory power and error size.
Key Decisions
The model selection stayed evidence-led. Although CNN-LSTM was included as the more complex sequence model, Random Forest produced the strongest result in the notebook and was easier to explain as a portfolio-ready baseline for non-linear demand behavior.
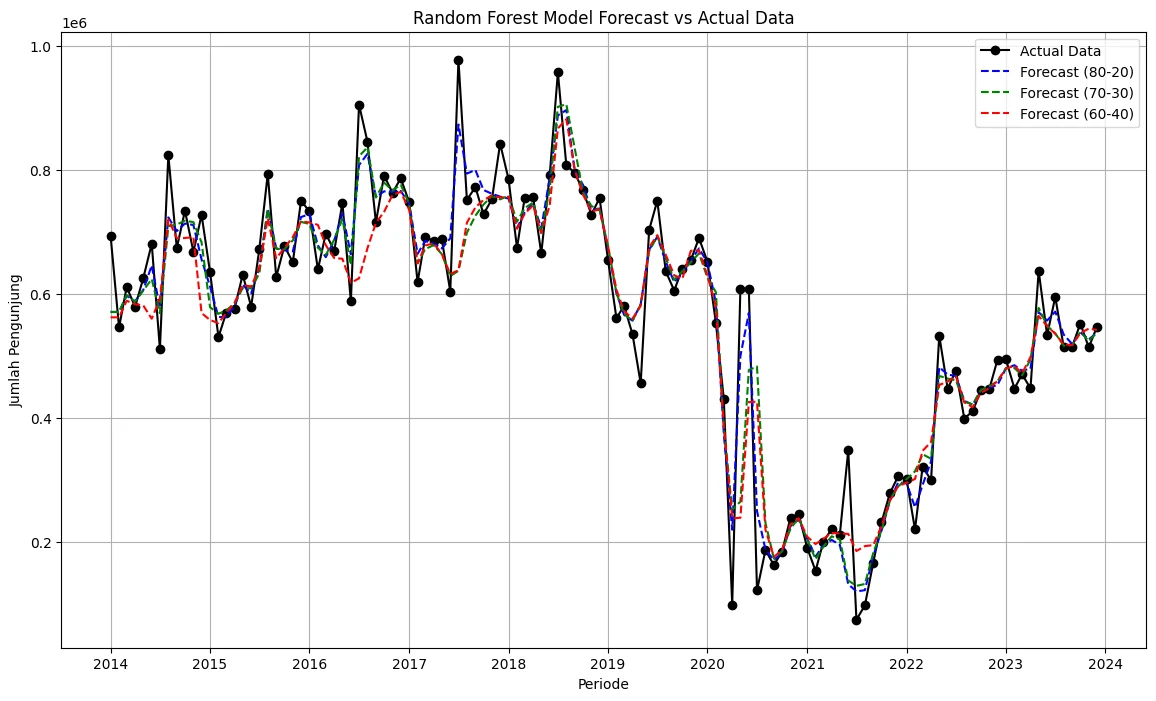
Notebook output: Random Forest forecast against actual data across the three train-test splits — R2 0.869 with MAE around 48k visitors on the 80-20 split.
Result
Notebook results on the 80-20 split, quoted from the model summaries:
| Model (80-20 split) | R2 | MAE (visitors) |
|---|---|---|
| Random Forest | 0.869 | 48,156 |
| CNN-LSTM | 0.347 | 54,063 |
| Linear Regression | 0.415 | 114,285 |
Random Forest Regressor became the strongest model in the notebook, reaching R2 0.869 and MAE around 48k visitors on the 80-20 split. The result suggests that non-linear ensemble modeling was a better fit for this dataset than a simple linear baseline or the tested CNN-LSTM setup.
What I’d Improve
I would replace random train-test splitting with chronological split or walk-forward validation, add seasonality features such as month and holiday periods, compare against ARIMA/SARIMA or boosting models, and visualize forecast intervals.